How to use the status page
Welcome to our status page. Stay informed and empowered as we provide you with live insights into our platform's performance, maintenance schedules, and any incidents that may affect your experience.
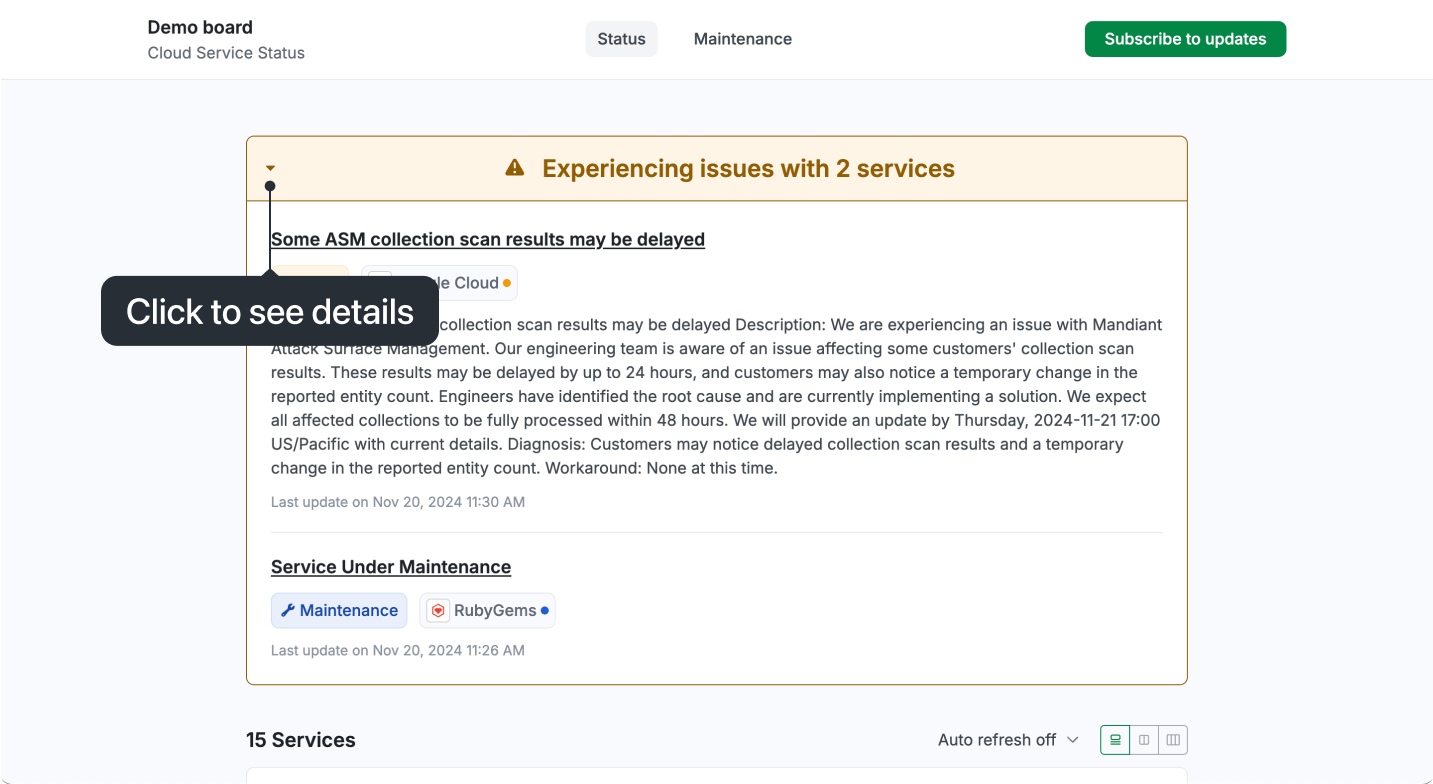
Checking ongoing incidents
Ongoing incidents are displayed prominently at the top of the page. Click the triangle icon to expand and view details, including specific incidents, affected services, optional descriptions, and the most recent update time. For more information, click on the incident name to access full details.
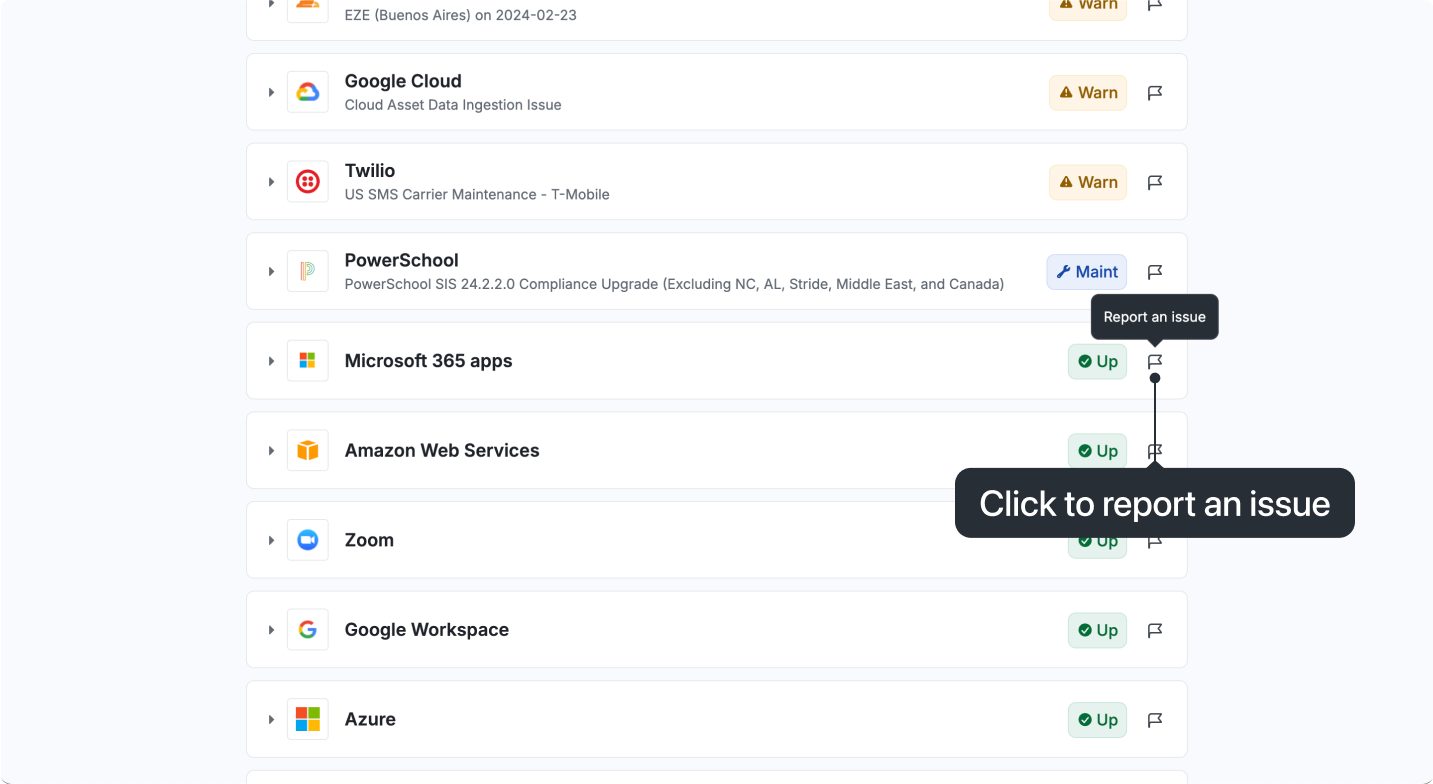
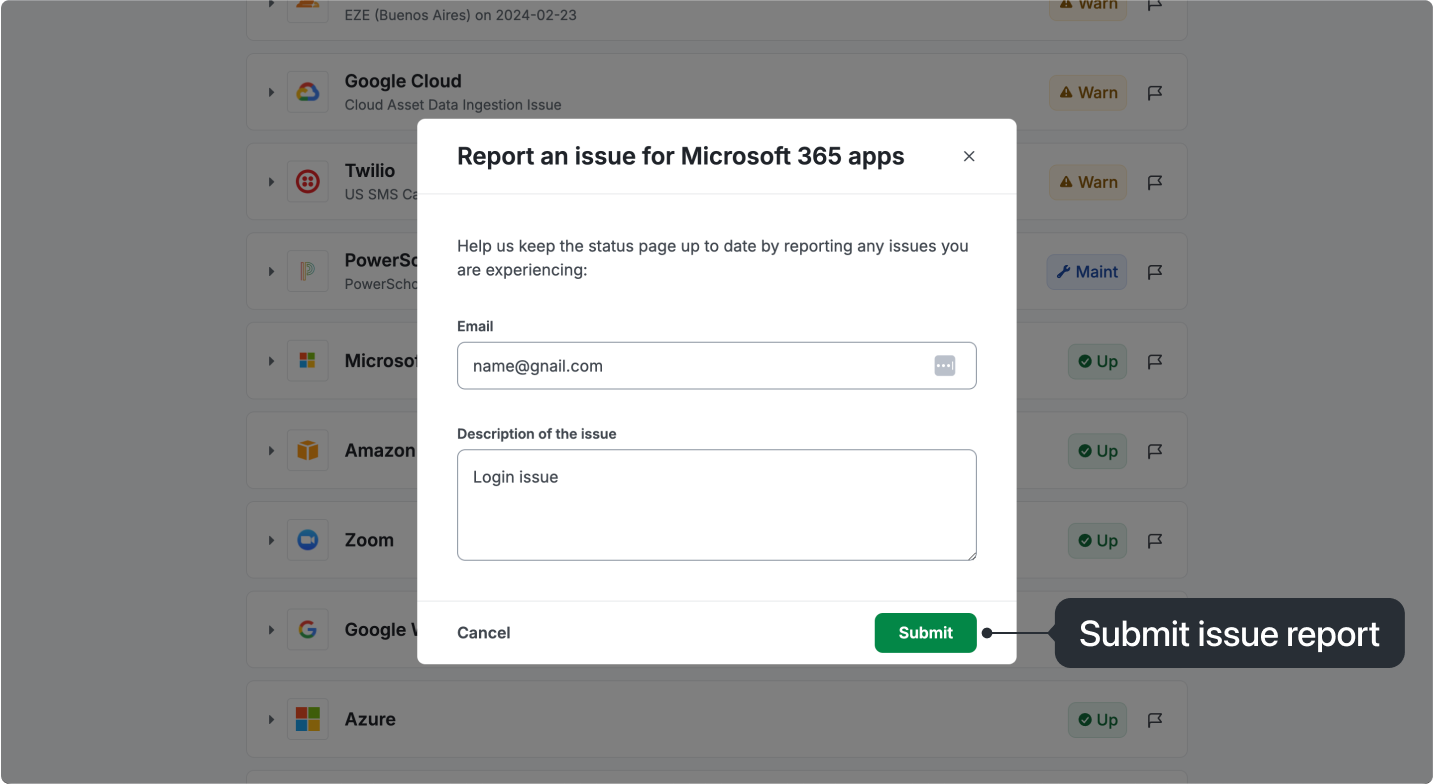
Reporting an issue
If you experience any issues that aren't reflected on the status page, you can report them by clicking the flag icon next to the specific service. You can also optionally include a description of the issue.
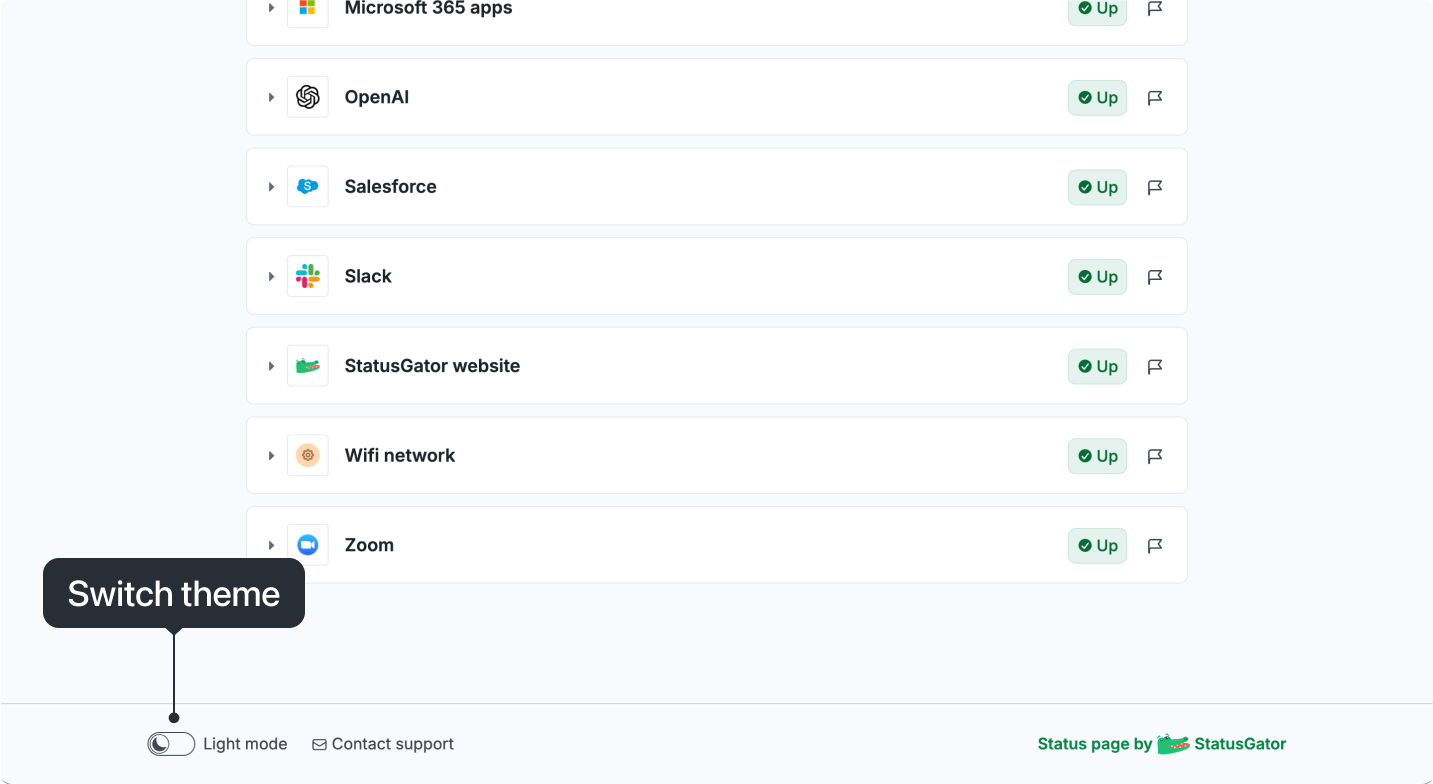
Customizing the status page view
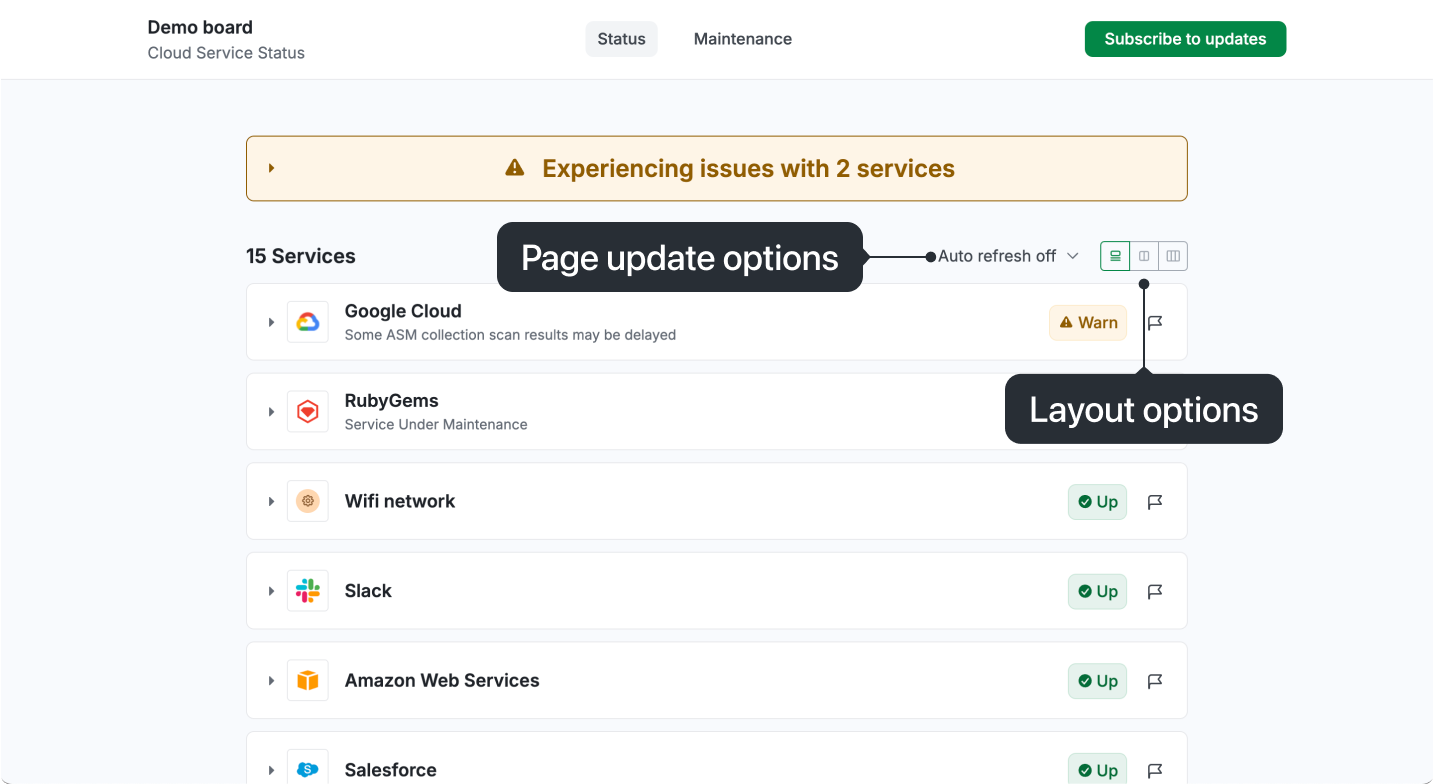
You can customize the view of the status page to suit your preferences:
- Switch between light and dark themes.
- Adjust the layout (choose from 1, 2, or 3 columns).
- Set your preferred page refresh interval.
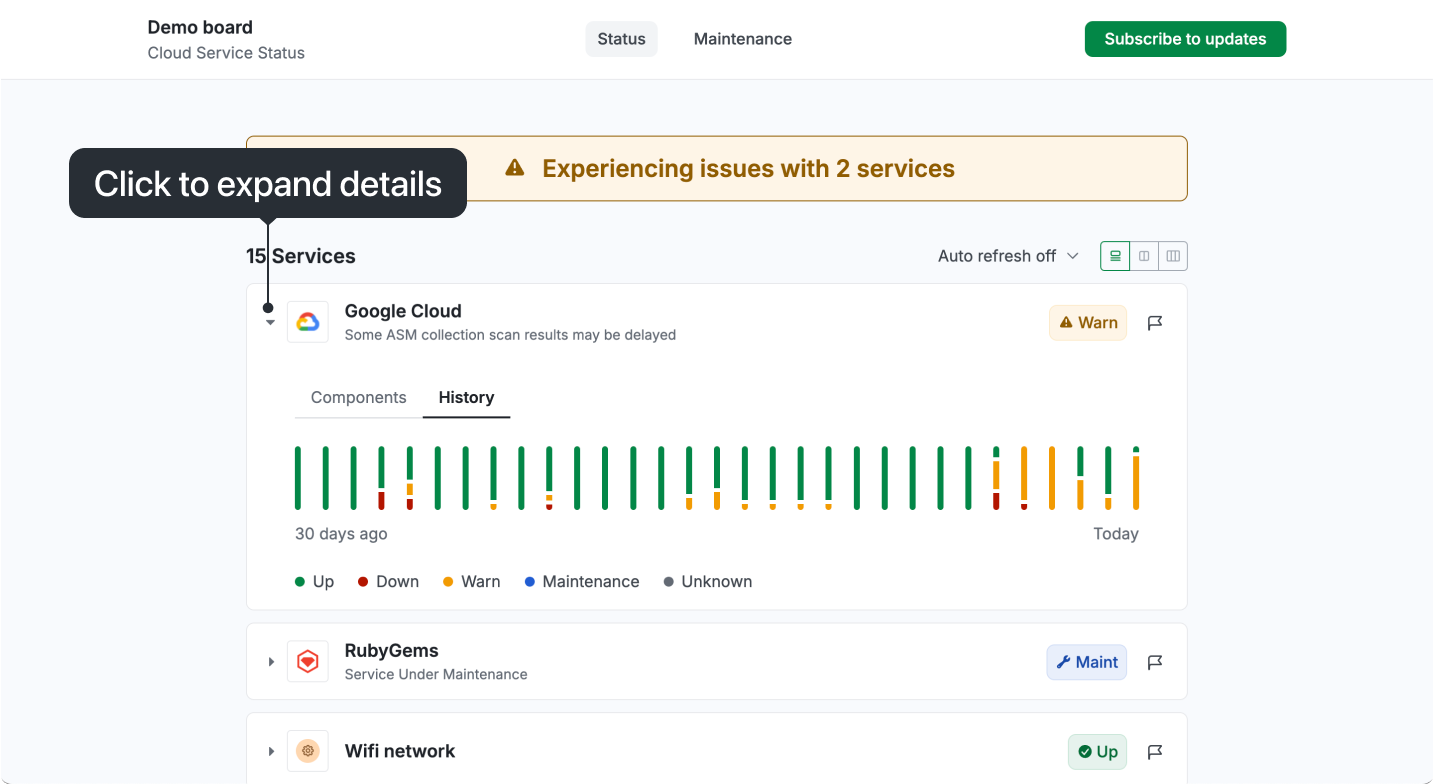
Checking monitor details
Click the triangle icon next to the monitor name, or the service name itself, to view its uptime history and component details. If you are using the 2-column or 3-column mode, clicking on the service will also display additional details.
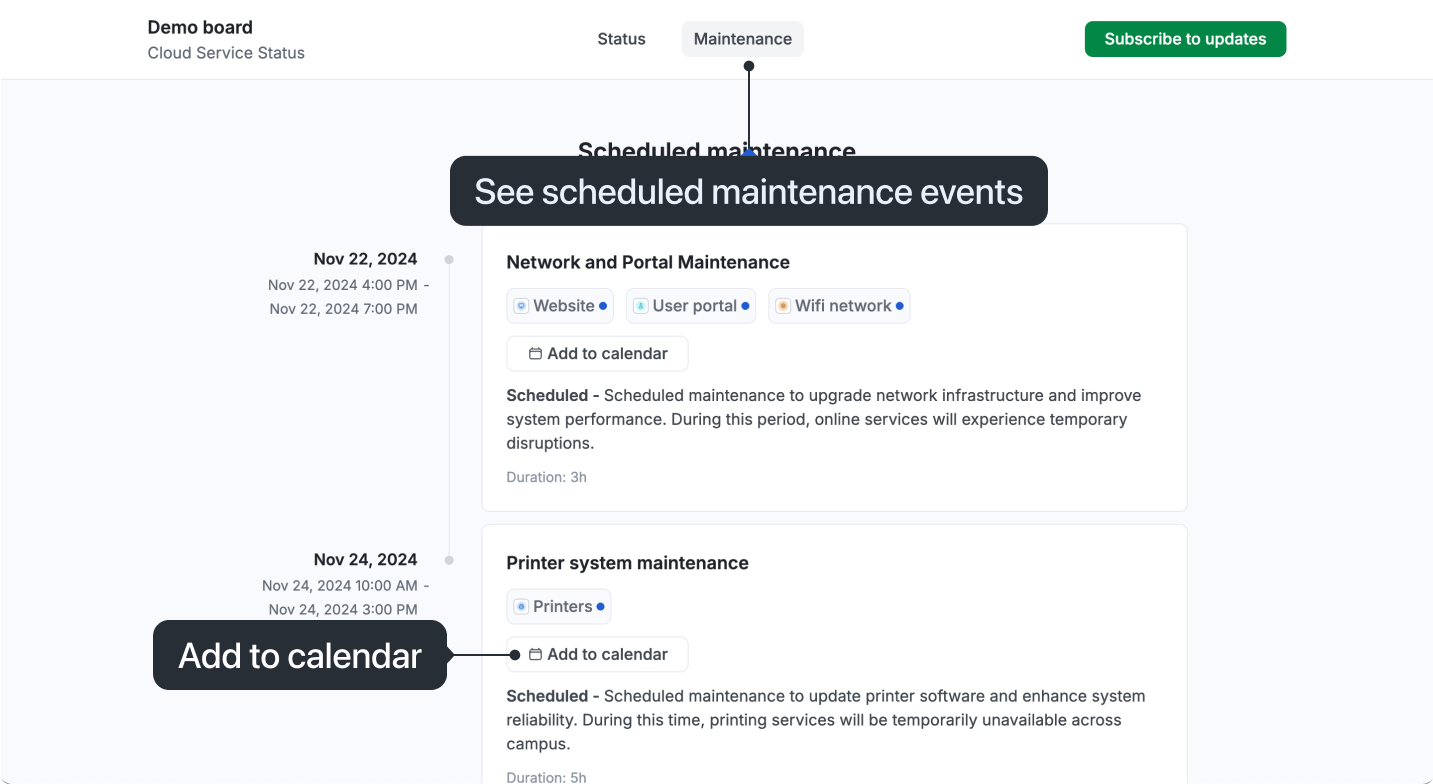
Checking scheduled maintenance
In the header menu, click the Maintenance link to view all scheduled maintenance events, organized from the nearest to the farthest date. You can see the scheduled date and time, affected services, and descriptions (if provided). Additionally, you can add these events to your calendar to ensure you don't miss them.
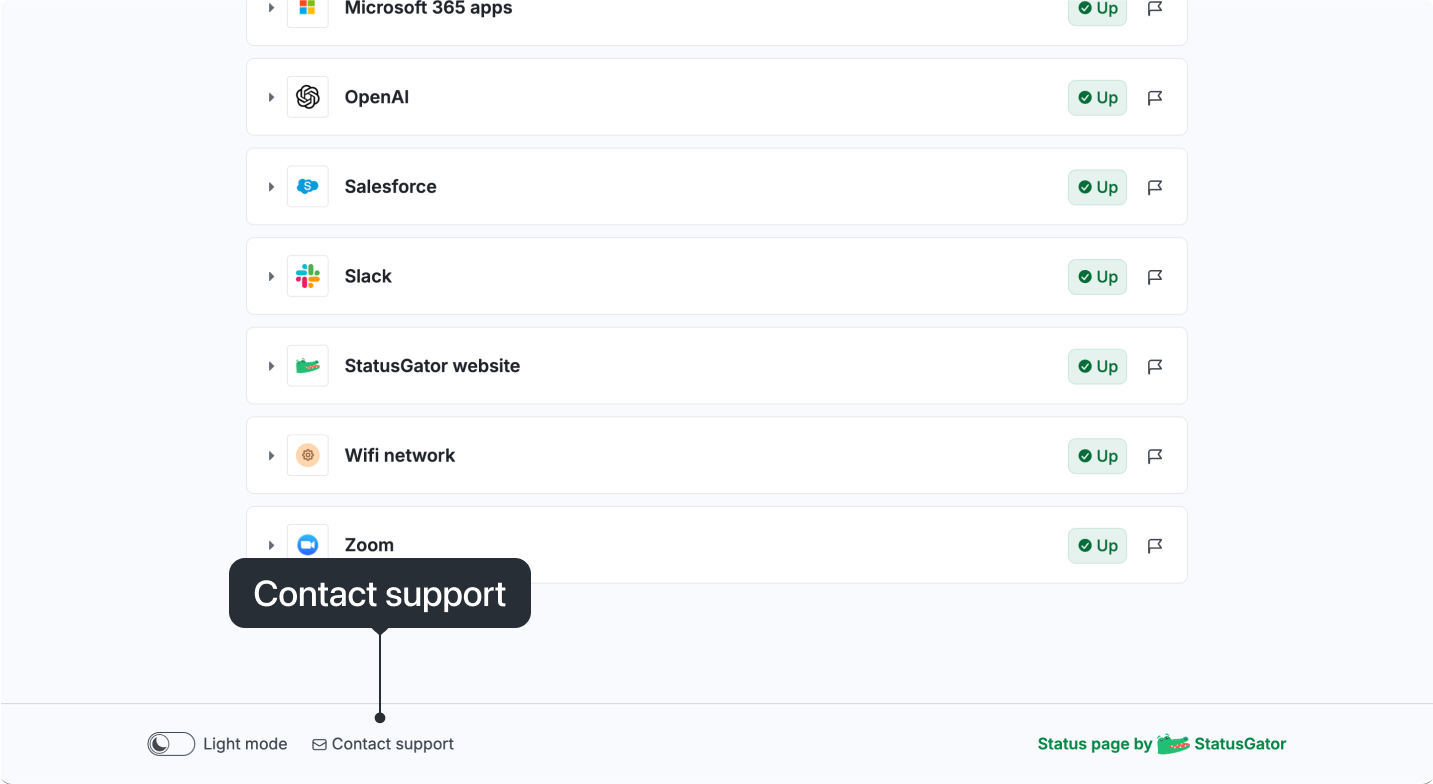
Contacting support
If support contact information is available, you can find it in the footer of the page.
 StatusGator